BitFire Dashboard
version 3.5.1+
BitFire Dashboard Usage Guide
Understanding the BitFire Dashboard
The Dashboard shows the last 400 blocks and last 400 alerts in a paginated view. Each Firewall rule can be set to alert mode or blocking mode. In alert mode the web request will be allowed but will be logged in the dashboard alerting. Block mode will stop the request and prevent the web application from receiving the request.
The top 3 graphs show the blocks (not alerts) from the previous rolling 24 hours. These blocks are broken down by type of attack, country of origin and time of attack. Lets look at each.
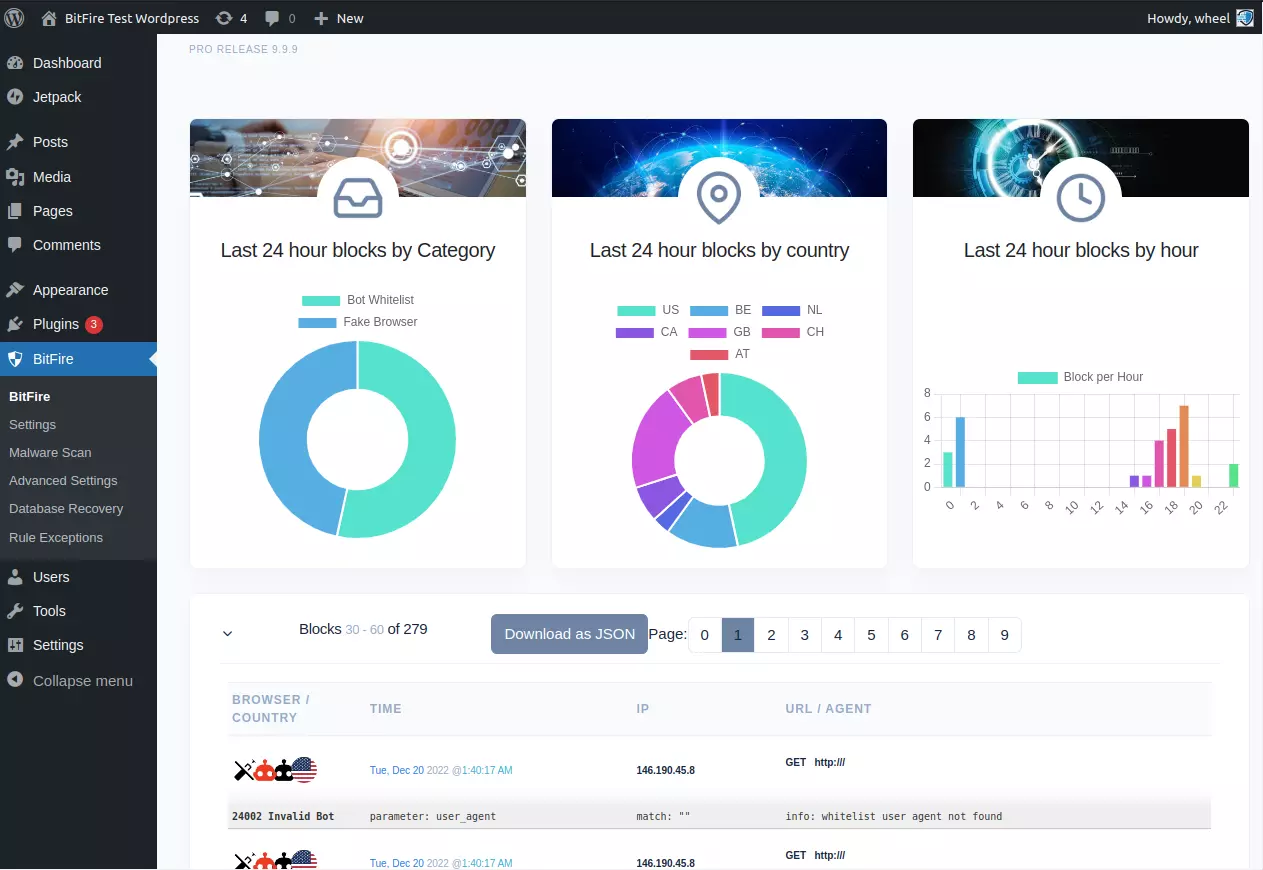
Blocks By Category
Every block performed by the firewall has a unique ID associated with it. These unique ids are grouped into categories. Dividing the ID by 1000 will yield the category id and modulo 1000 will yield the block id in that category. For Example: ID 24002 divided by 1000 would be category 24 (24000) which is bot blocking, 24002 modulo 1000 = 2, which is not found on whitelist.
Each block is broken down by the category of attack so you can see exactly what attacks your website is defending.
Blocks By Country
Every block tracks the origin IP address. When you view the dashboard, the origin country for each block is calculated and the percentage of blocks by country is shown.
Blocks By Hour
In addition to showing the percentage of blocks by origin country, each block is counted by the hour the block occurred. The times are adjusted to the local time of the web browser and shown in 24 hour format.
Block Detail

Each firewall block is listed with some important detailed information about the request. The right side of the block lists information about the blocked request. First, the source IP address is listed with the HTTP verb (usually GET or POST) followed by the requested URL. The following line show the request's User-Agent string.
Directly under the request information is a line in red detailing the unique block code, the name of the blocking category and a short info message detailing why the request was blocked.
On the left side of the block is the time the request was blocked (converted to local browser time) and 4 icons. The first icon is the magic wand. Click the magic wand to add an exception for this block and prevent BitFire from blocking similar requests in the future. The second icon shows a unique icon for each type of block. Holding your mouse over the icon will show additional detail about this type of block. The third icon shows the browser that was used for the request. The fourth icon shows the flag for the request country of origin.
Filtering Blocking Details
You can filter to just specific block types by using the "Filter Blocks" button on the top right of the detail view. When you select a specific type of block, only those types of blocks will be shown in the graphs and detail view. You can also invert this filter to exclude this category by clicking on the "Invert Filter" button next to the "Filter Blocks" button.
In addition to filtering the blocks, you can also paginate through the data by clicking on one of the pagination buttons in the center of the header. Each of the two pagination sections (block and alert) effects each section seperately. For example, page 0 alerts, and page 5 blocks will not effect the other lists paginator.
Downloading JSON block
Finally, you can download the latest 400 blocks or alerts by clicking on the "Download as JSON" button in either the block or alert section of the dashboard.